

A Direct Look at the Real Bottleneck
Launch dates do not slip by accident; they slip by design choices. china perfume bottle manufacturers often look similar on paper. You lock a delivery window, ship artwork, and expect a clean run. Then the first lot lands with a 4.8% incoming reject rate, wall thickness off by ±0.3 mm, and caps that seize at torque. Somewhere between hot end forming and cold end coating, the story bent. When you pick a perfume bottle empty factory, you imagine fit, finish, and speed—yet the hidden variables pile up: annealing lehr drift, mold wear, and ink adhesion after UV curing. Data says “almost fine.” Your shelf says “not saleable.” So the question is simple: why do smart teams still miss the obvious?
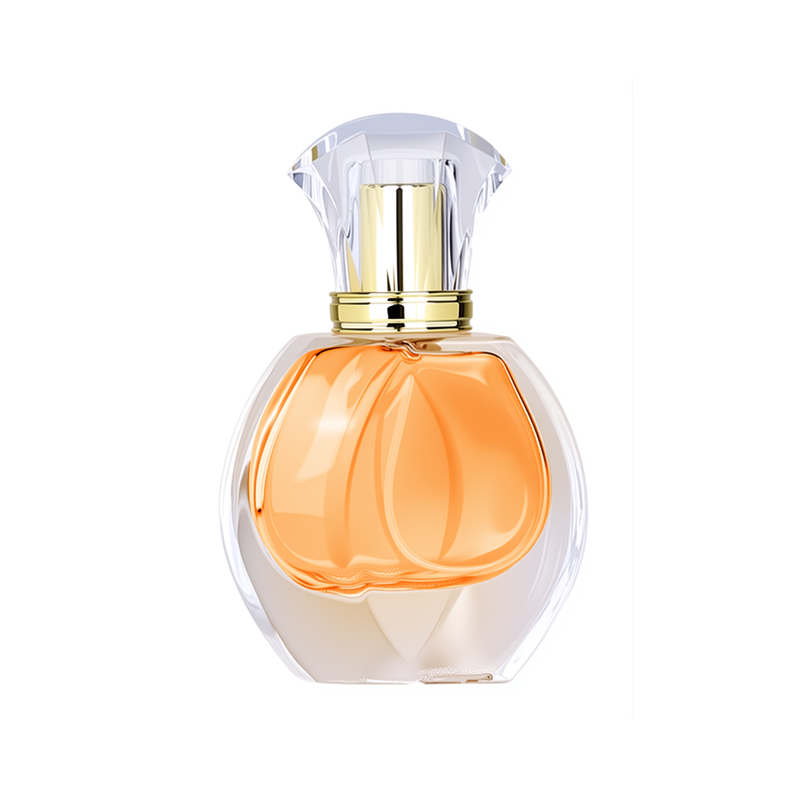
Here is the quiet scenario: cross-functional files are neat, but process capability is not. The IS machine can push rate, but not without raising ovality. Inline vision sees defects, but sampling protocol hides pattern drift. The factory promises “stable quality,” and it is—until SKU changeover loads a brittle setup, and downstream polishing exposes micro-scratches. You can call it a quality issue. It’s really a systems issue (inputs not mapped, controls not locked). Transition point: let’s break down what the traditional playbook fails to catch—and why it keeps hurting lead time and margin—funny how that works, right?

Traditional Fixes That Crack Under Load
What keeps breaking?
The usual answers feel safe: tighter inspection, more AQL, a bigger buffer. But those fixes attack symptoms. The deeper flaw is control mismatch. Prints specify ±0.2 mm, yet mold alignment drifts with thermal load; SPC sits on the lab PC, not at the IS machine console; and artwork sign-off ignores glass curvature, so silk-screening walks on convex panels. Then MOQ triggers a rush in the annealing lehr, raising residual stress that chips during frosting. Look, it’s simpler than you think: when process windows are wide and feedback is slow, every “fix” only delays failure. Tooling trials are run dry (no real-line heat), changeovers skip gage R&R, and torque targets are set without cap liner data. Even logistics inherits the mess—cartons sized for ideal yield, not actual fall-out. The result is a predictable pattern: extra rework, late color corrections, and post-polish haze. Traditional supplier audits check documents, not dynamics. They ask for certificates, not capability. Without real-time measures—Cpk at hot end, scratch index post-tumble, ink cross-hatch after cure—your assurance is theater. And theater breaks under load.
Comparative Insight: New Principles, Real Payoff
What’s Next
Shift the lens from “inspect more” to “control earlier.” Compare two routes. Route A: static inspection gates, broad tolerances, paper-based traceability. Route B: in-line vision linked to IS plunger profiles, closed-loop gob weight control, and SPC dashboards that trigger mold swaps before drift. The second path sounds heavy—until you see the math. When real-time signals drive micro-adjustments, you protect surface quality upstream, so downstream decoration stops fighting defects it did not create. Paired with digital tooling passports (QR per mold pair, heat map per cavity), you get root cause in hours, not weeks. That is how modern china perfume bottle factories differentiate: not by slogans, but by feedback latency and intervention discipline. Semi-formal take, practical core—control beats charisma.
Future-facing, the comparative edge grows wider. Modular molds reduce changeover shock; lehr recipes get versioned like software; and decorators plug into the same data spine, so ink rheology and flame-treatment are tuned to glass batch, not guess. Even better, pilot lots become experiments with defined hypotheses: “Raise gob temperature by 5°C; expect ovality delta −0.05 mm; verify via cavity-specific trend.” You move from hope to evidence—and yes, it shows. Summarizing the lesson without repeating it: misses hide in slow feedback and wide windows; wins come from fast signals and tight loops. To choose well, use three metrics: 1) Capability index at critical-to-quality points (Cpk ≥ 1.33 on wall thickness and finish flatness); 2) Traceability coverage from melt to screen (≥ 95% lot-to-cavity linkage); 3) Lead-time variance under 15% across three consecutive SKUs. Hold to those, and your “why did it fail?” turns into “how did we scale?”—a better question by far. Learn from practice, choose on evidence, and keep the loop tight with partners like NAVI Packaging.