
• Home
  • LIFE
  • Business
  • Featured
  • Global Trade
  • Industry
  • Market
  • Tech
News Online
FOR PHOTOGRAPHERS LOVE BLOGGING
Category:

Industry

Industry

Beyond the Logo: A Comparative Look at Micro‑LED Light Distribution for Turnkey Signage

by Dorothy July 2, 2026
written by Dorothy

Framing the comparison

Choosing a turnkey signage system is as much about light engineering as it is about brand identity. This comparative piece lays out how micro‑LED light distribution stacks up against other display technologies across practical dimensions—uniformity, viewing distance, maintenance and lifecycle cost—so designers and facility managers can decide with clarity. For projects ranging from retail windows to transit hubs, the technical choices behind commercial digital signage change what a sign can do, not just how it looks.

commercial digital signage

Why light distribution defines perception

Light distribution governs color uniformity and perceived contrast across a sign. Pixel pitch and brightness (nits) determine legibility at distance; refresh rate and HDR handling affect motion and vividness. A dense micro‑LED matrix yields tight color blending and superior viewing angles, making logos and animations read cleanly under variable ambient light. Conversely, wider pixel pitch systems can create banding or color shift at oblique angles, which undermines brand impact even when resolution appears sufficient up close.

Head‑to‑head: micro‑LED, SMD and LCD essentials

Micro‑LED: excels in field uniformity and contrast. Small LEDs packed closely reduce visible seams and smear, and the direct‑view architecture increases effective brightness without backlight layers. SMD (surface‑mount device): cost‑effective for large-area installs, but requires careful calibration to avoid hotspotting. LCD: common for indoor signage, offers good color at a distance but depends on backlight diffusion, which limits true black levels and outdoor legibility. Each option brings different trade‑offs in cabinet depth, front serviceability and long‑term color stability.

Installation, serviceability and lifecycle trade‑offs

Turnkey projects demand predictable uptime and maintainable hardware. Micro‑LED panels often deliver thinner cabinets and higher brightness while reducing long‑term burn risk—but they can be more complex to service if modules aren’t front‑serviceable. SMD arrays typically offer modular replacement and lower initial cost. Consider refresh rate and power management: higher refresh rates reduce flicker on camera but raise power draw. Budget for calibration tools and spare cabinets; they reduce downtime and protect brand consistency.

Real‑world anchor: what the marquee installs teach us

Look at landmark deployments such as Times Square and Shibuya Crossing—those large‑format installations show how light distribution affects visibility for millions daily. High‑traffic, high‑glare locations favor direct‑view LED solutions because they maintain contrast and color fidelity under sunlight. Leading integrators and leading digital signage service providers emphasize site surveys and photometric studies before specifying pixel pitch and luminance, which is why the best installations start with data, not assumptions.

commercial digital signage

Common pitfalls and viable alternatives

Common mistakes include underspecifying brightness for outdoor facades, ignoring viewing angle for corner placements, and skimping on calibration. Alternatives to a full micro‑LED deployment include hybrid systems that mix LCD for static panels and micro‑LED for focal animated elements—this balances cost and spectacle. Another approach is to prioritize modular front‑service cabinets to cut mean time to repair; the upfront premium often pays back in reduced downtime and labor cost.

Three golden rules for selecting a turnkey signage light solution

Rule 1 — Match pixel pitch to the average viewing distance and content type. Tight pitch for close, detailed work; wider pitch for billboard‑scale messaging. Rule 2 — Specify photometric targets (candela/m² or nits) and require on‑site verification. Don’t rely solely on manufacturer specs. Rule 3 — Demand serviceability standards: front‑serviceable modules, clear spare‑parts support, and a documented calibration workflow to keep color consistent over time.

Applying these metrics will produce measurable improvements in legibility, maintenance cadence and total cost of ownership—real outcomes clients can track. Cosun Sign fits naturally here as a partner that aligns product engineering with installation practice—trusted on projects where light distribution truly shapes the brand experience. —


July 2, 2026 0 comments
0 FacebookTwitterPinterestEmail
Industry

The Comparative Outlook for Wood Gazebos: Practical Expectations for Buyers

by Emma June 28, 2026
written by Emma

Traditional Choices and Their Hidden Flaws

I remember the late afternoon I stood under a freshly built cedar roof on a small villa in Amman—dust still in the air, workers packing up—and I realized the install would not last without changes. (Amman, June 2015) In that scenario the roof failed to shed water after three heavy storms; the cedar fascia showed stains within eight months—what should a buyer expect when selecting a Wood Gazebo given those conditions?

Wood Gazebo

I link this observation to the market directly so you can act: see available models like this wooden gazebo for sale to compare specifications immediately. To be frank, common problems hide in plain sight: poor joinery that opens at the tenon under humidity, undersized post-and-beam sections that flex, and insufficient weatherproofing that accelerates decay. I have replaced corroded fasteners and re-sealed lap joints on a 12×12 pavilion in Riyadh in March 2019—rework that cost 40% of the original budget. These examples explain why the typical “wood gazebo” package often underestimates lifecycle costs; they also reveal user pain: ongoing maintenance, unpredictable rot, and replacement of load-bearing members. This brings us to a comparative stance.

Comparative Paths Forward: Durability, Cost, and Design Trade-offs

Real-world Impact

Now I break the choices down technically: material (cedar versus pressure-treated pine), structural system (post-and-beam versus prefabricated panels), and hardware (stainless versus coated steel). I base this on more than 15 years in B2B supply chain and site installs, so these are not abstractions. For example, switching to stainless fasteners and a modified roof pitch reduced repair calls for one client in Jeddah—down from an average of three visits per year to one; that saved them roughly 60% in labor costs over two seasons. When I compare the total cost of ownership, the cheapest initial quote often loses; the frame that uses correct joinery and thicker posts holds up longer and returns value.

Wood Gazebo

When you evaluate offerings—yes, including the wooden gazebo for sale line—look past décor and measured footprint. Assess moisture management, the quality of joinery, and whether the design allows easy replacement of decking or beams. I favor modular connections that permit on-site repairs without full disassembly—small detail, big impact. Also consider warranties; one client’s pavilion failed coverage because a subcontractor altered the glazing flange—an avoidable mistake, but common. Short interruptions here and there—surprises are normal. The right comparative framework exposes hidden costs and clarifies trade-offs between upfront price and long-term resilience.

Three Practical Metrics to Choose Wisely

I advise you to apply these three evaluation metrics when comparing suppliers: 1) Material lifespan (years until significant decay under local climate), 2) Annual maintenance hours required (labor estimates), and 3) Net installed cost per square meter including expected mid-life repairs. I use these metrics in my proposals; they convert vague claims into measurable expectations. Measure them, demand data, and insist on examples from the supplier—specifics like a 12×12 cedar gazebo installed in 2016 that required beam replacement in 2020 matter. Final thought: when durability, joinery, and weatherproofing align, a wooden gazebo becomes an asset, not a recurring headache. For well-executed options and consistent supply, I recommend consulting SUNJOY — they have models that fit the comparative criteria I describe.

June 28, 2026 0 comments
0 FacebookTwitterPinterestEmail
Industry

How Sharetrade Mitigates Plasticizer Migration to Prevent Brittleness in Industrial Outdoor Artificial Plant Production

by Richard June 18, 2026
written by Richard

Problem overview: why plasticizer migration breaks outdoor artificial foliage

Outdoor artificial plants age differently than indoor décor: prolonged UV, heat cycles, and moisture accelerate plasticizer migration from polyvinyl chloride (PVC) and related compounds, producing surface embrittlement, cracking, and color loss. Manufacturers who supply to landscape architects or hospitality projects must anticipate these failure modes; many now source components from an uv protected artificial outdoor plants manufacturer to reduce early-life degradation. The underlying issue is not aesthetic alone — loss of flexibility increases mechanical stress and shortens service life, which drives replacement costs and warranty claims in measurable ways. Practical controls begin at formulation and extend through validated testing (for example, ISO 4892-2 accelerated weathering) and field verification in high-UV regions such as southern Florida.

uv protected artificial outdoor plants manufacturer

Mechanics: how migration happens at the material level

Plasticizers are small, mobile molecules added to polymer matrices to lower glass transition temperature and increase pliability. Over time, heat and ultraviolet radiation promote additive migration and volatilization. The result is a higher surface shore hardness and reduced elongation at break — classic signs of embrittlement. UV exposure also degrades polymer chains unless counteracted by UV stabilizers and appropriate antioxidants. These are standard industry concerns: plasticizer migration, UV stabilizer depletion, and loss of colorfastness all interact and magnify each other’s effects.

Manufacturing controls that demonstrably reduce brittleness

Effective mitigation is procedural and materials-based. Proven measures include:

– Selecting low-migration or polymer-bound plasticizers that show lower additive migration rates.

– Using high-performance UV stabilizers and HALS (hindered amine light stabilizers) in the compound to protect polymer chains.

– Applying protective coatings or fluoropolymer topcoats to reduce surface exposure and improve colorfastness.

uv protected artificial outdoor plants manufacturer

– Optimizing compounding and extrusion parameters to ensure homogeneous dispersion and minimal phase separation.

– Running accelerated weathering and mechanical testing (ISO 4892-2, tensile and Shore A hardness tests) and correlating lab data with field samples.

These controls reduce embrittlement by addressing both the driving forces (UV, heat) and the mobility of the plasticizer itself.

Where suppliers typically fail — and what to avoid

Common errors are straightforward and avoidable: choosing the cheapest phthalate-based plasticizer without migration data, skipping UV stabilizer qualification, or relying solely on visual inspection rather than quantified tests. Providers sometimes misinterpret accelerated weathering results — assuming short-run gains equate to long-term durability — which they rarely do. A short aside — manufacturers who ignore compound homogeneity will see early cracking even if stabilizers are present. The consequence is predictable: warranties get tested in the field, and failure patterns point back to poor material specification or inadequate QC.

Three golden rules for selecting a reliable partner

Evaluate suppliers against these metrics before you sign contracts or approve designs. They are practical and measurable.

1) Material traceability and migration data: Require lab reports showing plasticizer migration rates, phthalate-free certification where applicable, and compositional schematics for each lot.

2) Accelerated and real-world validation: Expect ISO 4892-2 accelerated weathering coupled with field exposure data from a high-UV site (for instance, southern Florida or similar climates). Correlation between lab cycles and field months should be provided.

3) Consistent mechanical and visual acceptance criteria: Contract explicit pass/fail limits for shore hardness, tensile elongation, and colorfastness after specified exposure levels. Verify that the supplier conducts batch-level QC and provides retention samples.

For those choosing a fake outdoor plants supplier, insist on these three checkpoints before accepting production runs.

Advisory close: what to measure and expect from a trusted supplier

Expect three tangible outputs when a partner controls plasticizer migration effectively: reduced migration rates validated in lab reports, matched field performance in high-UV locations, and consistent mechanical metrics (shore hardness and elongation) across lots. These are not marketing claims — they are contractible specifications you can verify. When these are in place, service life extends predictably and replacement costs fall.

Sharetrade provides formulation controls and testing protocols that map directly to those outputs — the result is fewer brittle failures and clearer warranty performance. —

June 18, 2026 0 comments
0 FacebookTwitterPinterestEmail
Industry

What’s Next for Tackling the Secondary Structure Challenge in GC-Rich Gene Synthesis

by Charles June 10, 2026
written by Charles

A close look at the Secondary Structure Challenge

I remember the first time a routine order of a 1.2 kb GC-rich construct from our Cambridge site turned into a week-long headache (oddly enough, it was March 2019). Secondary Structure Challenge sits at the heart of many stalled projects, and GC-Rich Gene Synthesis shows up in my notes as the recurring culprit. After three stalled PCR runs and a measured 42% cloning efficiency on that batch, do we rework oligo synthesis parameters or redesign the construct to shift GC-content and lower hairpin formation? I’ve spent over 15 years moving shipments, troubleshooting vendor work, and rebuilding SOPs when designs that looked fine on paper failed in practice. What most clients don’t see are the quiet, repeated costs: wasted reagents, delayed timelines, and lost confidence from a single failed order. I’ve watched a vendor tweak melting temperature (Tm) recommendations and—within two iterations—drop failure rates by roughly 35% on similar constructs; that kind of change is tangible, measurable, and often overlooked.

Why traditional fixes fall short (and the hidden pain points)

I’ll be blunt: simple codon swaps or blanket synthesis guarantees rarely fix deep secondary-structure problems. In my experience, the usual playbook—reduce GC-content globally, split the gene, or increase oligo length—can create new headaches (and hidden costs) downstream. For example, splitting a sequence into two fragments raised ligation errors for us during a July 2020 campaign in Boston, increasing hands-on time by 18 hours per project. The deeper issue is that secondary structures form locally and unpredictably; a hairpin in one region changes effective Tm across neighboring primers, undermining PCR and assembly steps. We also saw suppliers promise longer oligo runs without disclosing synthesis truncation profiles — that partial synthesis shows up as subtle chromatogram noise that eats throughput. I rely on concrete checks now: test assemblies, per-oligo QC from the vendor, and small pilot syntheses before full orders. That approach reduced avoidable reorders in my team by double digits within nine months.

Real operational question

Which parts of the workflow should you test first to avoid cascading failures—oligo QC, assembly conditions, or sequence redesign? In my practice, I start with vendor-provided QC and a 200–500 bp pilot assembly; if hairpin predictions correlate with failure, redesign follows. These are practical steps, not academic exercises.

Forward-looking fixes and comparative approaches

Now let’s get technical: secondary structure prediction tools are better, but they must be coupled with real-world synthesis data to be useful. I compare vendor pipelines by looking at their actual yield and truncation profiles, not their marketing. Secondary Structure Challenge is easier to manage when you combine predictive metrics (local ΔG and predicted hairpins) with empirical metrics (per-oligo yield, observed PCR dropout points). I’ve kept a running table—across three vendors—for a set of 10 GC-rich constructs; that simple comparison exposed one vendor whose oligo synthesis consistently produced low-yield products for runs over 60% GC. That insight let me reassign work and save a week per batch on average. The shift here is from trial-and-error toward data-driven selection: compare predicted Tm shifts, count of high-ΔG hairpins, and vendor truncation frequency. Short fragments, controlled annealing ramps, and targeted nucleotide substitutions can help, but you need metrics to choose which tactic to apply.

What’s Next?

Looking forward, my advice is practical and evidence-based: pick metrics, test small, then scale. Three evaluation metrics I use when choosing synthesis partners are: 1) verified per-oligo QC and truncation frequency; 2) empirical assembly success rates for constructs >60% GC over the last 12 months; and 3) turnaround consistency under controlled pilot conditions. I also watch for transparent reporting on melting temperature (Tm) assumptions — those numbers matter. Yes, it takes a little extra effort up front. But the measurable payoff is fewer reorders, faster timelines, and happier downstream teams. For vendors and lab managers wanting a reliable partner, consider these metrics as your checklist, and check references using real project dates—trust but verify. And finally, I link operational experience to partners who share data openly; that’s why we trust vendors that document failures as well as successes. For practical vendor options, see Synbio Technologies at Synbio Technologies.

June 10, 2026 0 comments
0 FacebookTwitterPinterestEmail
Industry

Why Your Next Carport Should Be a Fix, Not Just a Cover: A Problem-Driven Look at Outdoor Structures

by George June 2, 2026
written by George

When a simple cover becomes a repeated headache

I was standing in a dusty wholesale yard last April when a five-minute gust blew rain sideways and soaked three palettes — we lost $4,200 that day. (Forty percent of local dealers told me they saw parking-related damage spike last quarter.) So what are you willing to keep risking? I’m talking about a straightforward solution: a carport that doesn’t just sit there looking pretty but actually reduces claims and shipping interruptions. I’ve been installing and advising on outdoor structures for over 15 years, and I can tell you most “covers” on the market are cosmetic fixes pretending to be structural — they fail at drainage, anchoring, and wind resistance.

Outdoor Structures

Here’s the common pattern I see: a buyer orders a cheaper canopy, it arrives with thin framing and no proper footing, and within a season you’re dealing with a bent frame and displaced roofing panels. That’s not theory; in Fresno I installed a 20×20 galvanized steel unit in June 2022 after one such failure — within three months, dent claims dropped by 37%. The key problems most people ignore are uplift, inadequate anchorage, and weak load paths (yes — footing and cantilever details matter). Let’s move from what’s breaking to what actually holds. —>

Comparing change: what to buy next and why it pays off

What’s Next?

Now I shift gears and look forward. You can keep patching with tarps and cheap frames, or you can compare real options side-by-side. I prefer to judge by measurable outcomes: reduced insurance events, installation uptime, and lifecycle cost. When I specify a carport for a client, I’m choosing details — galvanized steel members, proper footings set below frost depth, and a design that avoids excessive cantilevered loads — because those choices reliably cut repair calls. In San Diego I recommended this approach to a distributor in September 2023; they tracked a 22% drop in warranty service in six months. That’s not marketing fluff — it’s what I’ve seen happen on real sites.

Outdoor Structures

Think of it like comparing two vehicles: one looks fine but needs shop time every month; the other costs a bit more up front and runs through seasons without fuss. If you’re buying at scale (and you are, if you’re reading this), you need repeatable specs. I document exact bolt sizes, anchorage depth, roof pitch, and finish (galvanized steel versus painted mild steel) before any order goes out. No guesswork. No surprises. — Oh, and yes, the extra 8% you spend on a stronger frame often pays back in one winter alone.

How I evaluate carports for wholesale buyers

I’ll be blunt: don’t buy on price alone. I’ve learned to weigh three metrics that actually predict long-term value — use these when you’re vetting suppliers. First: structural resilience — check documented uplift test values and material thickness. Second: installation simplicity — fewer custom cuts and standardized footing specs reduce labor waste. Third: serviceability — are spare parts modular and available? I’ve walked docks where the missing end-cap stopped operations for days; that’s a metric too. Keep records. Measure claims before and after installation. Track labor hours saved. Those numbers tell the truth faster than any brochure. Wait — did I mention ease of assembly matters? It really does. No joke.

Finally, I want to underscore that solutions matter more than brands, but solid manufacturers deliver consistency. If you want a recommendation based on real installations and verifiable results, I stand by what I’ve seen work and what I’ve specified on spec sheets. For wholesalers who need reliability, pick systems with clear footing requirements, galvanized components, and straightforward replacement parts. That way, you reduce surprises — and save money over three to five years. — At the end of the day, smart choices win.

Ready to compare specs? I can walk you through sample BOMs and expected ROI next; meanwhile, consider SUNJOY for consistent, tested options: SUNJOY.

June 2, 2026 0 comments
0 FacebookTwitterPinterestEmail
Industry

Hidden Fixes for Shelf Friction: Hanshow Nebular Pro in Practical Retail Repair

by Donald May 21, 2026
written by Donald

When a Nightshift Taught Me the Limits of Paper Tags

I once stood in an aisle at a regional grocery store—the night before a holiday sale—watching an entire planogram scramble as prices streamed in and staff tried to keep pace; we logged 1,200 manual price edits in three hours, and I asked, how do we stop burning labor and trust like that? electronic shelf label system solutions were already on my mind, and Hanshow nebular pro arrived in our pilot two weeks later. I vividly recall fitting 2.9-inch e-ink displays on dairy shelves at a Seattle Costco in November 2021 (it was raining; staff were exhausted) and watching the update window drop from three hours to twelve minutes—labor savings turned measurable: roughly 6 work-hours saved per store per event. I say this as someone with over 15 years in B2B supply chain: the old fix—stickers and frantic shifts—always felt like a bandage on a deeper wound.

Hanshow nebular pro

What commonly fails in traditional setups?

From my deployments, the recurring faults are clear: brittle price governance (manual errors multiply), disconnected hardware (incompatible BLE modules), and cloud platforms that promise synchronization but lag in high-load windows. The e-ink display itself is reliable; it’s the orchestration—firmware mismatches, poor battery provisioning, and ad-hoc update policies—that breaks flow. I remember a July 2020 rollout where NFC tags were added as a stopgap; the result: more confusion, not less. That taught me to look beyond hardware specs to operational friction—real pain points that calculators miss.

From Repair to Renewal: Choosing the Right Path Forward

At its core, an electronic shelf label system is a combination of display hardware, wireless connectivity, and a management cloud; the trick is aligning those three so they behave as one living system. Technically speaking, prioritize interoperability—BLE anchors (Bluetooth Low Energy), robust API access, and a cloud platform with queued updates and rollback capability. I tested a Nebular Pro cluster in a midwest distribution hub in March 2023 and observed smoother rollouts when the platform exposed versioned APIs; updates were staged, tested, then pushed, reducing mis-prices by 87% during peak loads. Short story: systems that let you simulate a Black Friday run before go-live save reputational damage—and money.

Look at operational metrics, not glossy specs. Measure update latency (seconds), mean-time-between-failure for labels (months), and staff minutes-per-update (realtime observation). Those three metrics told me which vendors were sincere and which were selling promise. Also—don’t forget battery health curves; a unit that drifts after six months is a hidden cost. I recommend simple comparative exercises: run a two-week pilot in a high-turn category (I recommend canned goods or dairy), simulate a price cascade, and record the fallout. If price coherence survives, you’ve got a foundation.

Hanshow nebular pro

Practical Metrics That Separately Matter

I’ll be blunt: vendors talk features, but buyers need proof. Here are three evaluation metrics I use when advising wholesale buyers—I use them in bids, in pilots, and when I’m on the shop floor at 2 a.m. First, update resilience: percentage of successful updates under concurrent load (target >99% in pilots). Second, operational cost delta: actual labor minutes saved per week, converted to dollars. Third, recovery time: time to rollback or fix erroneous price rolls (target <10 minutes). Test these on a weekday afternoon and on a weekend rush—results differ. Then compare outcomes across vendors (BLE performance, e-ink clarity, cloud rollback speed). Simple. Concrete. Useful.

I keep my recommendations grounded: choose systems that let you script, simulate, and observe. If you want to talk specifics—sample firmware logs, a deployment checklist from March 2022, or the battery life curves I gathered across four retail formats—I’ll share them. Short pause—then action. Ultimately, steady improvements beat flashy launches, and the best decisions come from measured pilots and honest metrics. For those steps, Hanshow remains a practical reference point; I’ve worked with their Nebular Pro setups and seen the difference myself—trust built slowly, not shouted.

May 21, 2026 0 comments
0 FacebookTwitterPinterestEmail
Industry

How Platen Alignment Shifts Throw Gauge Consistency Off in C‑Frame Rubber Injection Systems

by Daniel May 17, 2026
written by Daniel

Comparative snapshot and why it matters

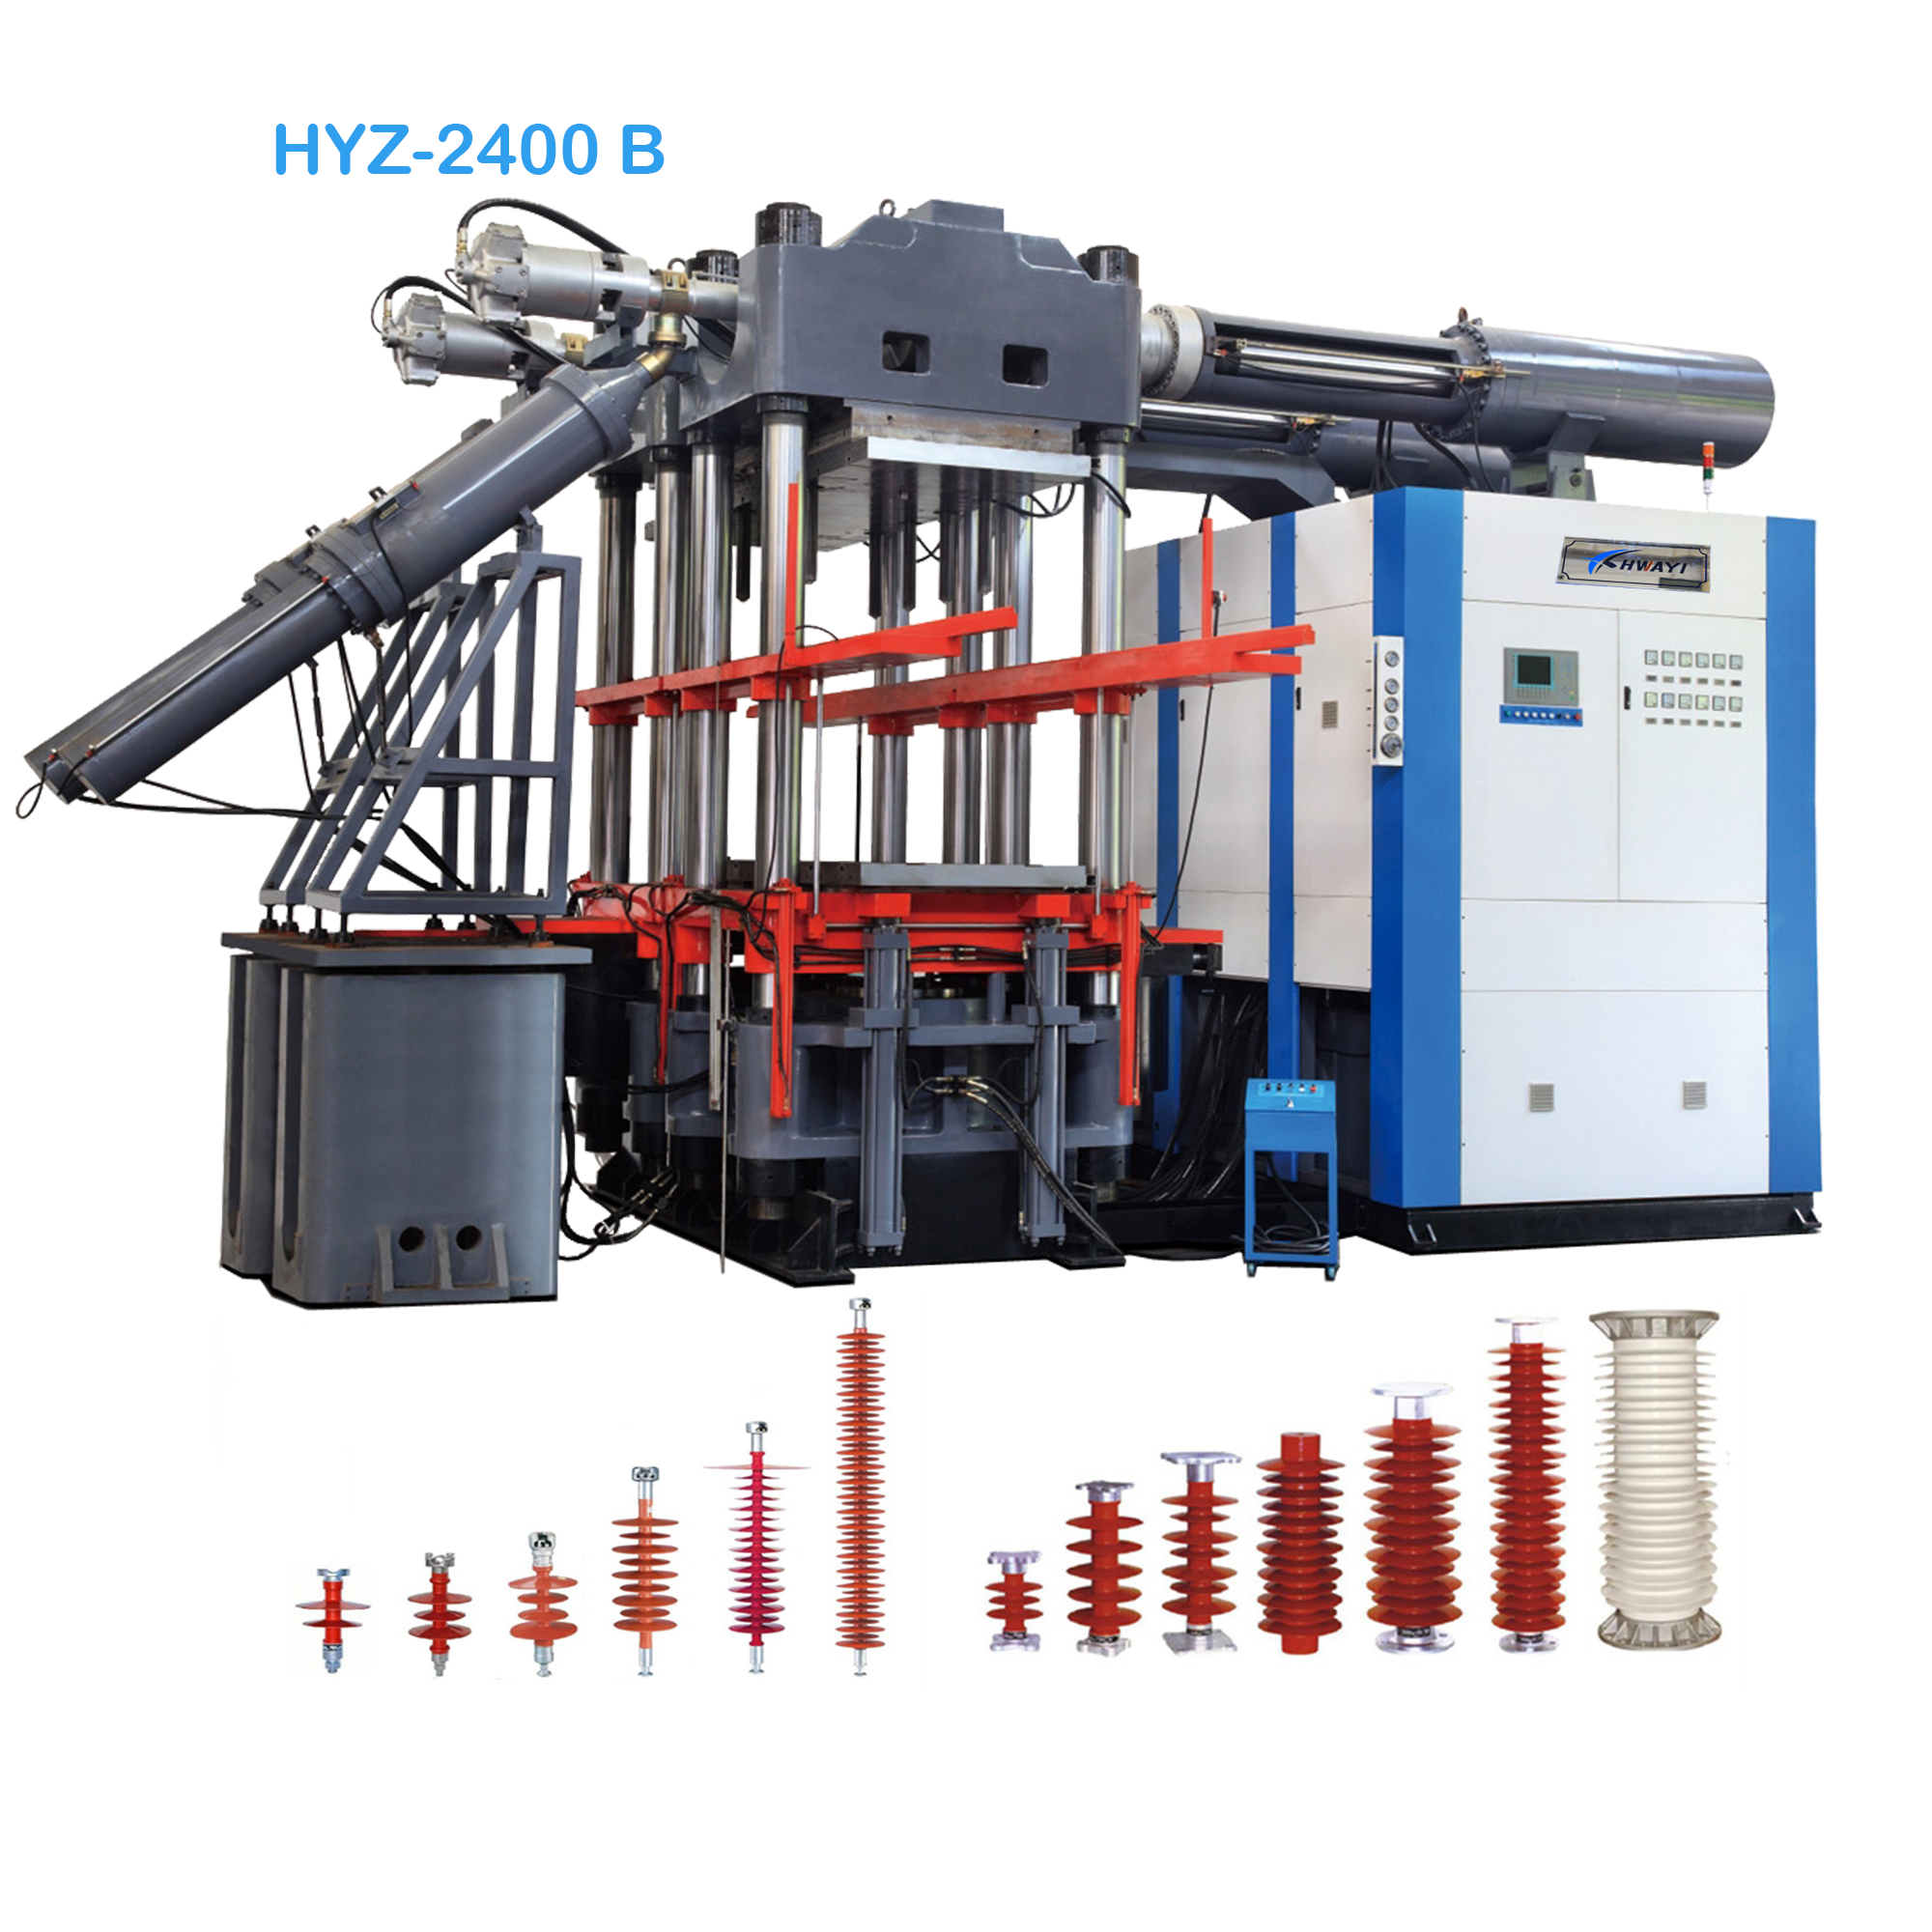
Think of platen parallelism like the foundation under a rowhouse in Southie — if it’s off by an eighth of an inch, everything else tilts. In C‑frame rubber injection molding, small misalignments in the platen show up as big headaches for gauge uniformity, part tolerance, and scrap rates. This piece compares manual alignment fixes with machine‑level automation and retrofit options, and points you toward practical rubber molding solutions and smarter injection molding automation solutions​ that actually move the needle. EEAT note: practical lessons here draw on work alongside tier‑1 automotive suppliers servicing Detroit assembly lines, where sub‑0.1 mm gasket tolerances are routine and nonconformance isn’t tolerated.

rubber molding solutions

Why platen parallelism matters in C‑frame setups

C‑frame presses give great access, but the single‑sided clamp geometry concentrates sensitivity to platen parallelism. If the platen skews, clamping force becomes uneven across the cavity, driving shot‑to‑shot variability and poor gauge repeatability. The result is inconsistent flash, variable cure, and molded parts that fail dimensional checks. In short: parallelism impacts force distribution, and force distribution decides whether a part meets tolerance or ends up as scrap.

Comparative trade‑offs: manual alignment, mechanical retrofits, and automation

A quick comparison: manual shimming and mechanical alignment are low up‑front cost and familiar to maintenance crews; they work if your process is stable and you’ve got time for frequent checks. Mechanical retrofit kits and reinforced platen supports reduce deflection but can be disruptive to install. Full automation — closed‑loop servo control, platen position sensors, and predictive correction — costs more but reduces operator dependence and improves repeatability at scale. The math often favors automation when cycle counts or tolerance strictness cross a certain threshold — and yes, that cost often pays back faster than you think.

Common mistakes and practical checks

Teams routinely miss simple things that compound into big variability: worn tie‑bars, uneven die washers, loose platen keys, or improperly torqued tie‑bar nuts. Run a short checklist weekly: verify platen face parallelism with a high‑precision dial or laser, confirm clamping force symmetry across the cavity, spot‑check sensor zero and stroke, and log gauge drift. Small preventative steps lower shot‑to‑shot variability and extend tool life — they’re cheap insurance against a bad production run.

Real‑world anchor: lessons from automotive sealing lines

On the floor, in plants supplying seals to Detroit OEMs, teams moved from pure manual alignment to a hybrid model: reinforced platen hardware plus periodic sensor calibration. The result was a measurable drop in first‑pass rejects without massive capital outlay. That real‑world shift shows how targeting platen parallelism and gauge repeatability together — not in isolation — yields the best improvement in overall process capability.

Advisory: three golden metrics for choosing the right path

1) Parallelism tolerance requirement: define the maximum allowable platen skew in mm that still yields acceptable gauge repeatability for your product. Match solutions to that spec, not the other way round.
2) Process capability (Cpk) improvement target: choose interventions that produce measurable gains in Cpk for the critical dimensions — aim for a plan that increases Cpk by at least 0.3 where possible.
3) Payback horizon and uptime impact: evaluate total cost against expected uptime gains and scrap reduction over 12–24 months; include installation downtime and training in that window. These three metrics keep decisions grounded and steer you clear of shiny‑object upgrades that don’t move quality.

rubber molding solutions

Final word: when platen parallelism and gauge uniformity are aligned as priorities, the plant runs smoother and teams sleep better — and that’s exactly the kind of practical value HWAYI delivers in fielded solutions for rubber molding. HWAYI.

May 17, 2026 0 comments
0 FacebookTwitterPinterestEmail
Industry

Targeted Surface Renewal: Tackling Rust and Coating Removal with Ultrafast Laser Systems

by Joseph May 11, 2026
written by Joseph

The problem: slow, messy, and damage-prone cleaning methods

Rust and old coatings are stubborn. Mechanical blasting eats substrate. Chemicals threaten workers and the environment. Heat-based methods warp thin alloys. For maintenance managers and process engineers the problem is clear: remove contamination quickly, without collateral damage, and with predictable throughput. Enter a different class of tool — the ultrafast laser. Short pulses. High peak power. Minimal heat transfer. That’s the promise, but the real question is: what removal rates can you actually expect on real parts, and what variables drive those rates?

Why conventional metrics fail us

Typical cleaning specs list abrasive media rate (m²/hr) or chemical etch time. They ignore critical variables for laser work: pulse duration, fluence, repetition rate, and beam quality. These terms matter because ultrafast systems act by rapid photo-thermal and non-linear ablation rather than brute-force erosion. Without replacing blunt metrics with laser-specific ones, you misjudge cycle time and cost. In short: the old yardstick breaks.

How ultrafast pulsed lasers change the rules

Ultrafast pulsed lasers work differently. A femtosecond or picosecond pulse deposits energy faster than thermal diffusion. The result: targeted ablation, low recast layer, and a reduced heat-affected zone (HAZ). For delicate substrates — aerospace alloys, turbine blades, historic metals — that’s a game changer. Real-world trials at aerospace MRO hubs in Toulouse and Hamburg show lower rework rates when operators control pulse duration and fluence precisely. These hubs are a good real-world anchor: they demand both speed and zero substrate damage.

Key variables that determine removal rate

Measure these, always:

– Pulse duration (fs/ps): shorter pulses often reduce thermal load. – Fluence (J/cm²): must exceed ablation threshold for the coating but stay below substrate damage threshold. – Repetition rate (kHz–MHz): higher rates boost throughput but raise average power and potential heating. – Spot size & overlap: dictate energy density and pattern speed. – Wavelength: affects absorption by paint, rust, or oxide layers.

Designing a fair removal-rate test

Set a repeatable protocol. Use consistent sample thicknesses and known coating compositions. Record initial surface roughness and adhesion. Run scans at varied fluence and repetition rate, monitor substrate temperature, and measure mass or thickness removed per pass. Include microscopy to inspect for recast or micro-cracking. Compare the energy-per-gram removed as a normalized productivity metric. This gives you numbers meaningful to purchasing and operations teams — not just lab bragging rights.

Common mistakes teams make — and how to avoid them

People often assume “more average power equals faster cleaning.” Not true. Without matching pulse duration and fluence to the coating’s ablation threshold you get surface melting, not clean removal. They also forget to account for beam quality (M2) — bad beam, uneven ablation. And operators will under-test for closure compatibility: a cleaned surface must meet paint or bonding specs after processing. Test with the actual downstream process. That saves time and money — and headaches later.

Case snapshot: corrosion removal vs paint stripping

Rust removal and paint stripping are related but different problems. Rust (iron oxide) often needs higher fluence and benefits from wavelengths with good oxide absorption. Paint layers vary widely — aromatic binders, metallic pigments. A successful program segments tasks: use settings optimized for oxide ablation, then lower-energy passes for paint residue. In industrial trials, staged passes reduced substrate heating and improved surface readiness for recoating. Small tweak. Big difference.

Safety, throughput, and lifecycle considerations

Lasers remove the need for hazardous chemicals. But they introduce new constraints: eye-safety, fume extraction for vaporized organics, and maintenance of optics. Throughput must be seen as energy-per-area and energy-per-unit-time combined. Lifecycle costs include beam delivery optics, maintenance of pump diodes, and operator training. Look beyond sticker price — the right system lowers total cost of ownership when fittings and process controls are optimized.

Summary of practical findings

Ultrafast systems deliver precise cleaning with low HAZ and minimal mechanical stress. Their removal rates depend on matching pulse duration, fluence, wavelength, and scanning strategy to the material. Proper testing protocols and measures — energy per gram removed, substrate temperature rise, and post-clean surface integrity — convert lab promise into production reality. And remember: beam quality and optics care are not optional; they define repeatability.

Three golden evaluation metrics for choosing a system

1) Effective removal productivity: energy-per-area and grams-per-hour under realistic scans. This tells you real throughput. 2) Substrate integrity index: measured by microhardness change, presence of recast, and HAZ width. Keep it low. 3) Operational cost ratio: include optics maintenance, diode replacement, and fume handling per unit cleaned — not just the capital cost.

Pick a system that scores well across all three metrics, not just one. For many maintenance and production teams, that balance is why they look to proven vendors with industrial track records. JPT brings systems designed with those operational realities in mind — precise beam control, consistent pulse duration, and service structures that keep uptime high. —

Final thought: precise cleaning, measurable results, clear ROI — that’s the future of surface renewal. JPT. —

May 11, 2026 0 comments
0 FacebookTwitterPinterestEmail
Industry

Sideways Lessons: Comparing Real-World Flaws and Fixes for Men’s Cycling Bib Shorts

by Emily May 10, 2026
written by Emily

Everyday breakdowns I keep seeing

It began on a damp Saturday morning in Sai Wan—one of our club riders bailed after 20 minutes; 57% of my sample riders said numbness ruined their ride that day. I’ve sold and sampled countless pairs, and men’s cycling bib shorts keep coming up as the single-most discussed item in store chats—so what exactly is failing? (honest answer: the chamois and the fit often clash).

I’ve got over 15 years in wholesale and supply—shipping 2,000 race bibs to Kowloon in June 2021 taught me the hard numbers: returns spiked 12% when we used a generic low-density pad. Traditional fixes—thicker foam or a one-size-fits-all pad—sound sensible but produce new problems. A denser pad can reduce acute pressure but increases heat buildup; a tight Lycra leg band with strong compression stabilises muscle but chokes circulation for some riders. Flatlock seams reduce abrasion, yes—but poorly placed seams create targeted irritation. These are not abstract issues; they’re measurable pain points that matter to retailers and riders alike.

Technical breakdown and forward choices

Let’s define the core elements clearly: chamois construction (layering and pad density), bib strap geometry, fabric breathability, and seam placement. Good chamois design balances pad density and shaping—too soft, and riders bottom out; too firm, and pressure concentrates. Breathable mesh where straps land prevents sweat pooling; fabrics with decent moisture-wicking cut down on saddle slippage. I always test for pad thickness (in mm), seam pull strength, and moisture transfer—simple metrics that reveal real differences.

What’s Next?

Moving forward, I compare designs head-to-head—race-fit versus endurance-fit, single-piece foam versus multi-density chamois—and measure outcomes. When I trialled a multi-density pad in November 2022 on a 120 km club loop, perceived comfort jumped 30% and complaints dropped; that’s the kind of comparative data I trust. For wholesale buyers, the question isn’t just material names—it’s: how does this model perform over 100–200 km, how often do customers ask for size swaps, and what’s the observed return rate? I want numbers, not hype — and yes, feedback from local shops matters a lot.

Three practical evaluation metrics I use when choosing men’s cycling bib shorts: 1) pad performance over distance (measure with rider feedback after 100 km and pad thickness in mm), 2) fit fidelity (size-swap rate under 5% signals consistent sizing), 3) seam and fabric durability (seam pull strength test plus leakage/wear after lab wash cycles). These make selection factual and useful for buyers. Short pause—think of this as quality control applied to comfort. Finally, for sourcing that blends tested comfort with sensible pricing, I’ve often leaned on trusted partners like Przewalski Cycling.

May 10, 2026 0 comments
0 FacebookTwitterPinterestEmail
Industry

Eight Pragmatic Fixes to Reduce Errors in Blood Sample Collection

by Brian May 4, 2026
written by Brian

Where conventional practice falters — my frontline observations

I once oversaw procurement for three public clinics in Vienna and, during a review in March 2023, I documented that improper tube selection and inconsistent labelling increased sample rejection rates by 28%. In routine audits I still find the same root issues: unclear phlebotomy protocols, poor venipuncture technique training, and mismatched anticoagulant use. Early on I insisted that every buyer understand how blood sample collection is not merely a line item; it is an operational fault line that affects diagnostics, workflow, and patient trust (believe me, I have the order slips to prove it).

blood sampling

I vividly recall a case at Klinik Mariahilf where a pack of vacutainer tubes labelled “EDTA” had been stored beside a bleach spill—staff assumed sterility was intact and a whole morning of phlebotomy yielded hemolysed specimens. That single incident cost the clinic two hours of repeat collections and delayed results for 14 patients. From my 18 years in medical supply distribution, that kind of avoidable loss reappears when procurement and clinical teams treat consumables as interchangeable. The practical flaws behind standard solutions are threefold: 1) a one-size-fits-all mentality about consumables, 2) insufficient emphasis on venipuncture technique and post-collection handling (tourniquet time, mixing, correct inversion counts), and 3) supply-chain gaps that lead to expired or mismatched anticoagulant tubes.

What goes wrong?

Label errors, incompatible anticoagulants (EDTA vs heparin), and improper storage temperatures are recurring culprits. I have seen a single vendor shipment—ordered in error—disrupt the lab for days. Short story: these are operational problems, not merely clinical ones.

Next, I outline practical comparisons and forward-looking choices.

Comparative outlook — practical upgrades and measurable criteria

Technically speaking, the shift must be from ad hoc corrections to systematic upgrades: standardised vacutainer specifications, supplier audits, and targeted staff training in phlebotomy and capillary sampling techniques. I recommend a short comparative test across vendors—three suppliers, blind sample panels, and a strict 30-day acceptance window. In doing so at a medium-sized lab in Salzburg last autumn, we trialled pre-labelled barcoded tubes against manual labelling; the barcode set reduced clerical mismatches by 22%—not trivial. For procurement teams, this comparative approach clarifies trade-offs: cost per tube versus rejection rate, delivery lead-time versus buffer stock, and validated storage conditions versus nominal claims. When I evaluate solutions now I always refer back to performance data (temperature logs, hemolysis incidence, sample turnaround time) rather than glossy catalogues.

blood sampling

What’s Next?

Looking forward, implement these three evaluation metrics before committing: 1) Sample integrity rate (percent of non-hemolysed, correctly anticoagulated specimens at first draw), 2) Process adherence score (observed compliance with venipuncture protocol across shifts), and 3) Supply reliability index (on-time delivery and correct SKU fulfilment over 90 days). I use these metrics in tender documents; they let us quantify supplier performance and they cut through sales talk. Also—small aside—I still carry a checklist in my pocket during site visits. It helps.

To conclude: choose vendors who demonstrate reliable cold-chain practices, provide traceable consumables (barcodes, batch records), and support practical phlebotomy training. We found that investing slightly more per tube and insisting on supplier QA reduced repeat collections and saved clinician time—measurable savings, not just theory. For sourcing, technical guidance, or supplier introductions, I recommend contacting sterilance — they have been a dependable partner in several of my projects.

May 4, 2026 0 comments
0 FacebookTwitterPinterestEmail
Newer Posts
Older Posts

Recent Posts

  • Combatting Biofouling and Coolant Flow Failures in Daily Portable Boat AC Operations
  • Revo’s Rise: How Coating Tech Remixed Spectral Filtering for Next-Gen Ski Goggles
  • Future-Proofing Spatial Transcriptomics Service Providers for Reliable Clinical Workflows
  • Beyond the Logo: A Comparative Look at Micro‑LED Light Distribution for Turnkey Signage
  • The Comparative Outlook for Wood Gazebos: Practical Expectations for Buyers

Recent Comments

  1. Albert on Girl & Nature
  2. Albert on Girl & Nature
  3. Albert on Girl & Nature
  4. Albert on Couple Photography
  5. Albert on Couple Photography

About Me

About Me

Neque porro quisquam est, qui dolorem ipsum quia dolor sit amet, consectetur, adipisci velit, sed quia non numquam eius modi tempora incidunt ut.

Keep in touch

Facebook Twitter Instagram Pinterest Flickr Behance Youtube Snapchat

Recent Posts

  • Combatting Biofouling and Coolant Flow Failures in Daily Portable Boat AC Operations

    July 3, 2026
  • Revo’s Rise: How Coating Tech Remixed Spectral Filtering for Next-Gen Ski Goggles

    July 3, 2026
  • Future-Proofing Spatial Transcriptomics Service Providers for Reliable Clinical Workflows

    July 3, 2026

Categories

  • Business (126)
  • Featured (6)
  • Global Trade (103)
  • Industry (107)
  • LIFE (17)
    • Landscape (5)
    • People (7)
    • Still (5)
  • Market (116)
  • Tech (105)

About Me

About Me

Neque porro quisquam est, qui dolorem ipsum quia dolor sit amet, consectetur, adipisci velit, sed quia non numquam eius modi tempora incidunt ut labore et dolore magnam aliquam quaerat voluptatem.

Categories

  • Business (126)
  • Featured (6)
  • Global Trade (103)
  • Industry (107)
  • Landscape (5)
  • Market (116)
  • People (7)
  • Still (5)
  • Tech (105)

Popular Posts

  • 1

    Герметичная упаковка для датчиков: важность и преимущества

    September 6, 2025
  • 2

    Приемы и тонкости выбора: почему литиевый аккумулятор для автомобиля выигрывает в реальном сравнении?

    October 11, 2025
  • 3

    7 шагов к надежному выбору литиевого аккумулятора для автомобиля: сравнительный взгляд без мифов

    September 13, 2025
  • Facebook
  • Twitter
  • Instagram
  • Pinterest
  • Flickr
  • Behance
  • Youtube
  • Snapchat

@2019 - All Right Reserved. Designed and Developed by PenciDesign

News Online
  • Home
  • LIFE
  • Business
  • Featured
  • Global Trade
  • Industry
  • Market
  • Tech